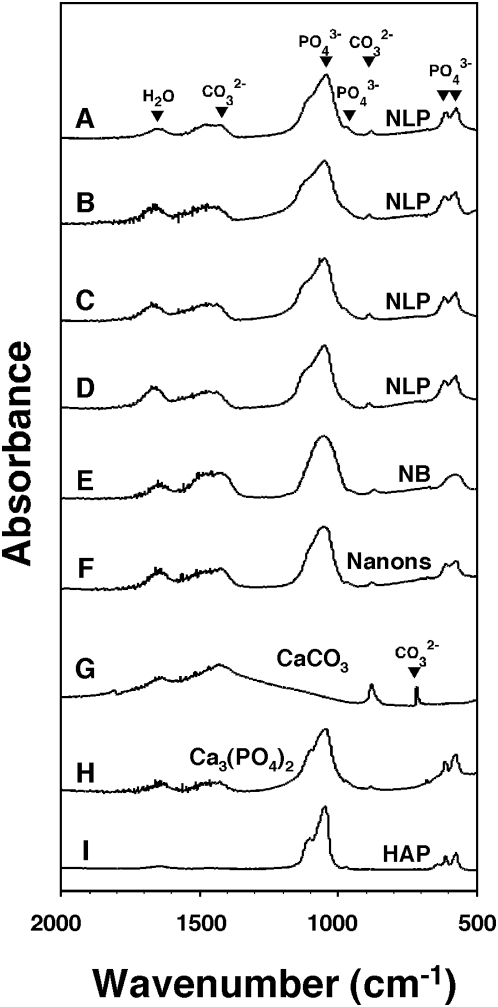
Figure 4. Fourier-transformed infrared spectroscopy of NLP and NB reveals the presence of both carbonate and phosphate groups.
(A–D) NLP were prepared as in Fig. 3 and submitted to FTIR spectroscopy (A) immediately after formation, or after the following periods of incubation at 37°C in DMEM: (B) overnight; (C) one week; and (D) one month. The FTIR spectrum of NLP revealed peaks characteristic of carbonate ions at 875 cm−1 (ν2) and 1,430 cm−1 (ν3). Phosphate peaks were also present at 566 cm−1, 604 cm−1 (ν4), and between 1,033–1,100 cm−1 (ν3). The peak seen at 1,651 cm−1 was due to the presence of water in the sample. (E and F) NB showing FTIR spectra similar to those of NLP. (E) NB cultured from DMEM containing 10% healthy HS, after one month. (F) “Nanons” after one week in DMEM without serum. Commercial powders of (G) CaCO3, (H) Ca3(PO4)2, and (I) HAP were included as controls. CaCO3 produced an additional peak near 650 cm−1 attributed to calcite that was not found in our experimental samples.

