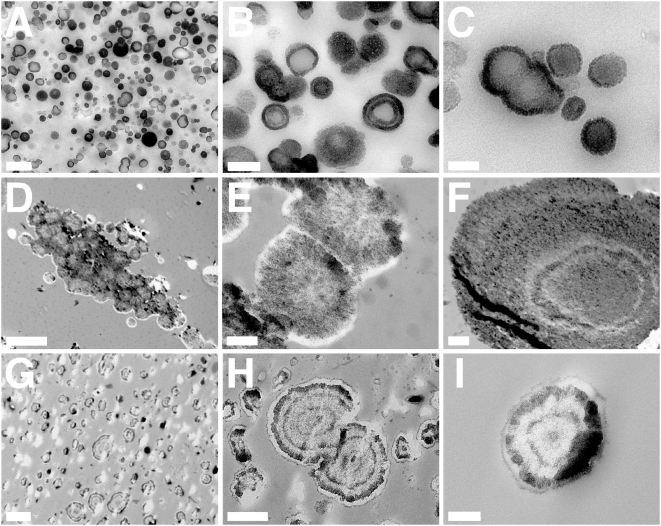
Figure 8. NLP and NB seen by thin-section TEM.
(A–C) Calcium phosphate NLP produced as in Fig. 3 and incubated overnight in DMEM. (A) shows heterogenous particles, while (B and C) represent enlarged views of (A), depicting round particles with thick concentric wall layers and crystalline surface with needle-like projections. Some particles appear to be undergoing cell division. (D–F) Calcium carbonate NLP obtained from the inoculation of 10 mM of CaCl2 and (NH4)2CO3 into DMEM, followed by overnight incubation in serum-free DMEM. (D) Aggregation of NLP to produce coalesced particles. (E and F) Enlarged images of (D), showing cell-division forms (E) and concentric multi-layers (F) with dense coating and crystalline structure. (E) Higher magnification image of the same NLP shown in D depicts a cellular division-like formation. Note the crystalline appearance of their surface and the interior of the particles. (G–I) “Nanons” after 2 days in serum-free DMEM, revealing multilayer crystalline rings surrounding an electron dense core. Scale bars: 100 nm (C); 200 nm (B, I); 500 nm (A, E, H); 1 µm (F, G); 5 µm (D).

