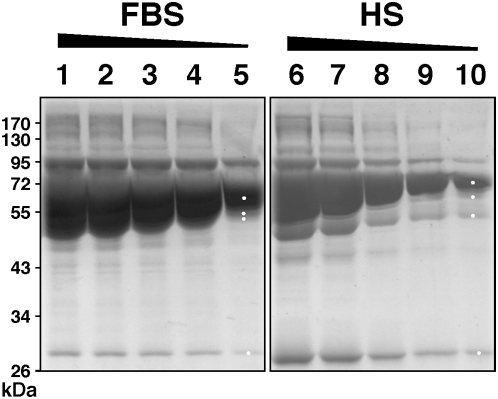
Figure 12. Protein profiles of whole FBS and HS.
SDS-PAGE of decreasing amounts of whole FBS (lanes 1–5), and HS (lanes 6–10). FBS or HS was used at 1∶100 dilution, with the following amounts of protein loaded onto each lane: lanes 1–5: 4 µg, 3.5 µg, 3 µg, 2.5 µg, and 1.5 µg, respectively; and lanes 6–10: 3 µg, 1.8 µg, 1.2 µg, 0.6 µg, and 0.3 µg, respectively. The white dots shown in lanes 5 and 10 correspond to the bands excised for protein identification by MALDI-TOF mass fingerprint analysis.

