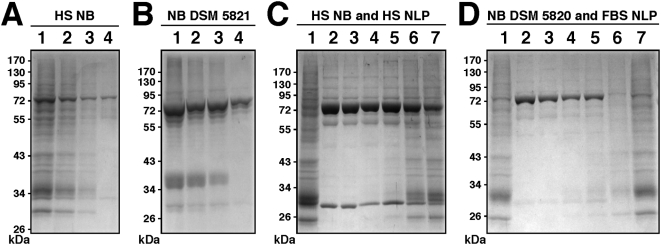
Figure 13. Protein profiles of NLP and NB as determined by their passage through serum-free or serum-containing medium.
(A) Protein profile of HS NB maintained in DMEM containing 5% HS (lane 1) followed by transfer to serum-free DMEM and incubation for 1 day (lane 2), 4 days (lane 3), and 6 days (lane 4), after which proteins were analyzed by SDS-PAGE. A gradual disappearance of proteins bands is seen with increased incubation time in serum-free medium. (B) Protein profile of NB strain DSM 5821 after 1 day in DMEM containing 2% FBS (lane 1), followed by transfer to serum-free DMEM for 1 day (lane 2), 4 days (lane 3), and 6 days (lane 4), again showing a gradual disappearance of bands. (C) Protein profiles of NB obtained from 10% HS as in Fig. 3 (lane 1) and HS NLP formed as in Fig. 3 except that 5% HS was present in the precipitating mixture (lane 2). HS NLP were then transferred to DMEM containing 5% HS and incubated for the following periods of time: 1 hr (lane 3), 1 day (lane 4), 4 days (lane 5), 10 days (lane 6), and 14 days (lane 7). A gradual increase of bands of low molecular weight could be seen along with a fading of the high molecular weight bands, especially the 70–72 kDa band. (D) Protein profiles of NB strain DSM 5820 maintained in 10% γ-irradiated FBS (lane 1) and FBS NLP obtained as in Fig. 3, except that 5% FBS was added to the precipitating mixture (lane 2). FBS NLP were inoculated into DMEM containing 5% FBS and incubated for the following periods of time: 2 hr (lane 3), 1 day (lane 4), 4 days (lane 5), 10 days (lane 6), and 14 days (lane 7). By day 14, the protein profile of these FBS NLP, with an increase in the number of bands and a loss of the 70–72 kDa band, closely resembled that of DSM 5820 (lane 1).

