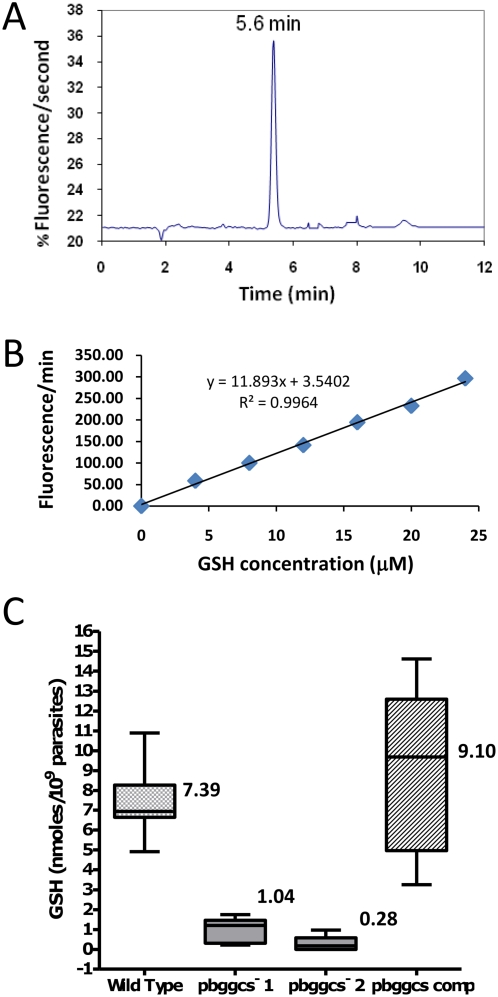
Figure 2. Total glutathione (GSH) levels in blood stages of wild type, pbgccs−, and pbggcs-comp parasites.
Intracellular GSH levels were determined by HPLC with a fluorescence detector as described in Materials and Methods. (A) Typical chromatogram of P. berghei parasite extracts showing the signal for total GSH (retention time 5.34 min). (B) Representative calibration curve using GSH standards in a range between 4 and 24 µM. (C) Comparison of total GSH concentration of WT, pbggcs−1, pbggcs−2, and pbggcs-comp parasites. GSH levels were determined in extracts of purified blood stages obtained from mice with asynchronous infections. A One Way ANOVA test shows statistically significant differences in GSH concentration between pbggcs− parasites and wild type (P<0.0001) and between pbggcs− and pbggcs-comp parasites (P<0.0001). Numbers on boxes represent the mean concentration of GSH. Bars represent the standard error of the mean. Wild type n = 20, pbggcs−1 n = 16, pbggcs−2 n = 22, pbggcs-comp n = 16.

