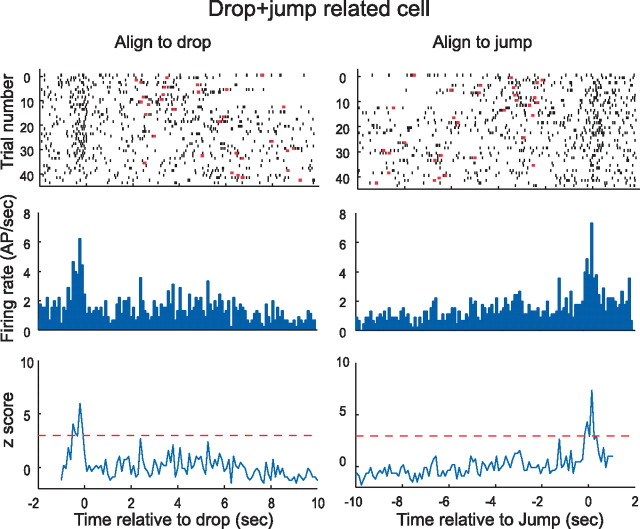
Figure 4.
An example of a pyramidal cell tuned to both drop and jump. The timescale for left column is aligned to the drop event, whereas the timescale for the corresponding right column are aligned to the jump. Except for trials for very long jump times that are not completely represented on either time base, the spike intervals are the same for a given trial in the raster plots. Note that aligning spikes to the drop event smears the peak associated with the jump event and vice versa. For this reason, the background firing during the wait time appears higher than in other examples. Note also that the peak rates (for drop and jump) are considerably lower than in the examples of Figures 2 and 3. The plots of z-score against time do not reach the astronomical values seen in Figures 2 and 3 because the peak rates are lower and the apparent background rates are higher. AP, Action potential.

