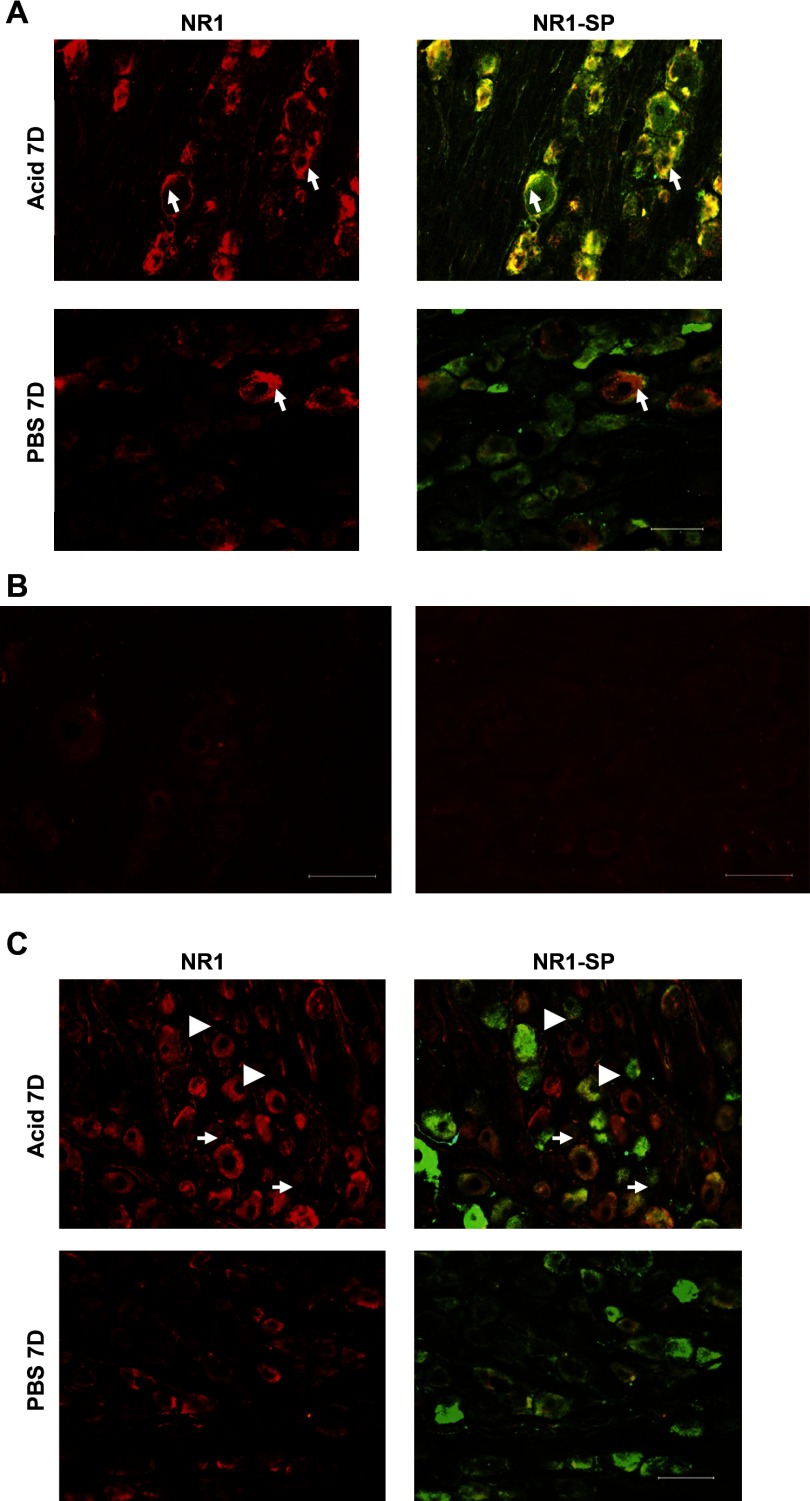
Fig. 8.
Photomicrograph of immunoreactivities of NR1 subunit and substance P (SP) in the thoracic T3 DRG and NG. A: immunostained sections (20 μm) of DRG from acid- and PBS-treated cats are represented at left and merged images of NR1 and SP stained sections are shown at right. The majority of (>90%) NR1-positive cells exhibited high expression of SP in the acid-treated cats compared with PBS-treated cats. Arrows indicate some of the small- and medium-diameter cells coexpressing NR1 and SP. B: in DRG, immunostaining with blocking peptide preabsorbed NR1 antibody failed to show significant immunoreactivities, indicating the specificity of the reaction (left). The immunostaining using normal rabbit serum as primary antibody also failed to show any specific immunoreactivities (right). C: immunostained sections (20 μm) of NG from acid- and PBS-treated cats are represented at left and merged images of NR1 and SP stained sections are shown at right. In NGs, <50% of NR1-positive cells exhibited SP immunostaining. Arrowheads indicate the NR1-positive cells not expressing SP and arrows indicate cells coexpressing NR1 and SP. Scale bar, 100 μm.

