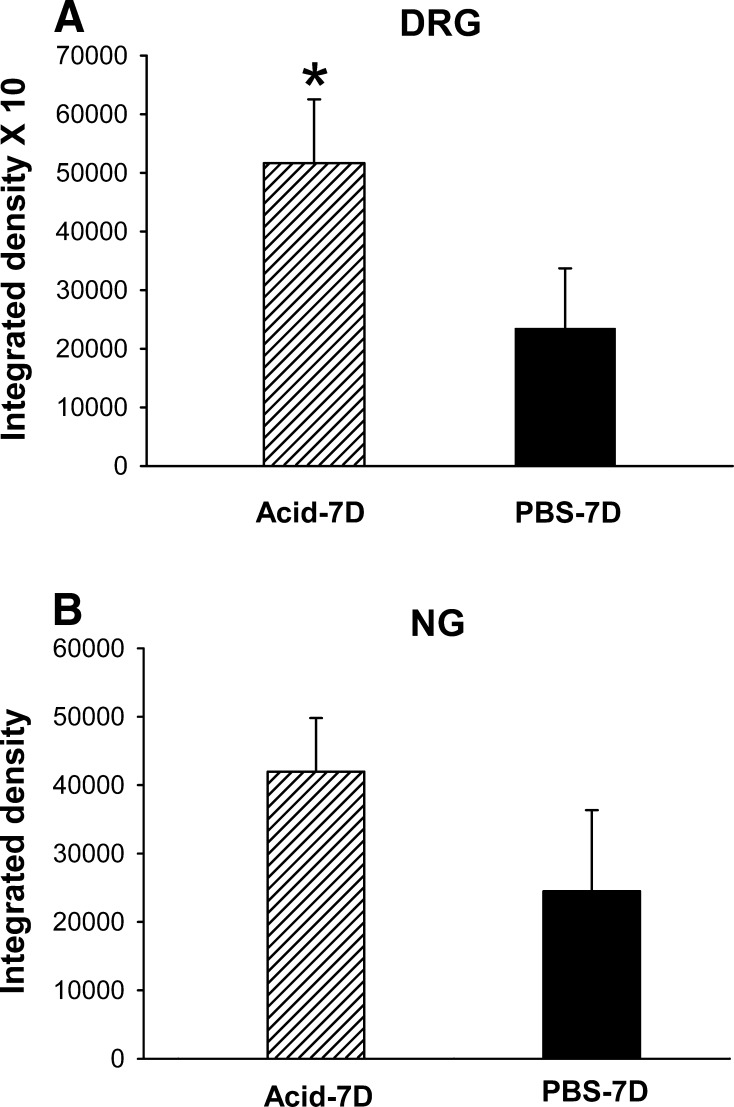
Fig. 9.
Quantitative analysis of NR1 staining in DRGs and NGs from acid- and PBS-treated cats. The fluorescence images were converted into gray mode. Arbitrary grayscale units (in the range of 1–255) were assigned to quantify the intensity of staining of a given cell. Nonspecific background staining was measured in a similar way by selecting cells with staining below the threshold limit for the positively stained cells. The intensity of staining for 10 individual cells from each group was determined and presented as means ± SE. A: there was significantly greater intensity of NR1 expression in thoracic DRGs following acid treatment compared with PBS-treated cats (P > 0.05). B: the intensity of NR1 expression in NGs from acid-treated and PBS-treated cats.

