Fig. 7.
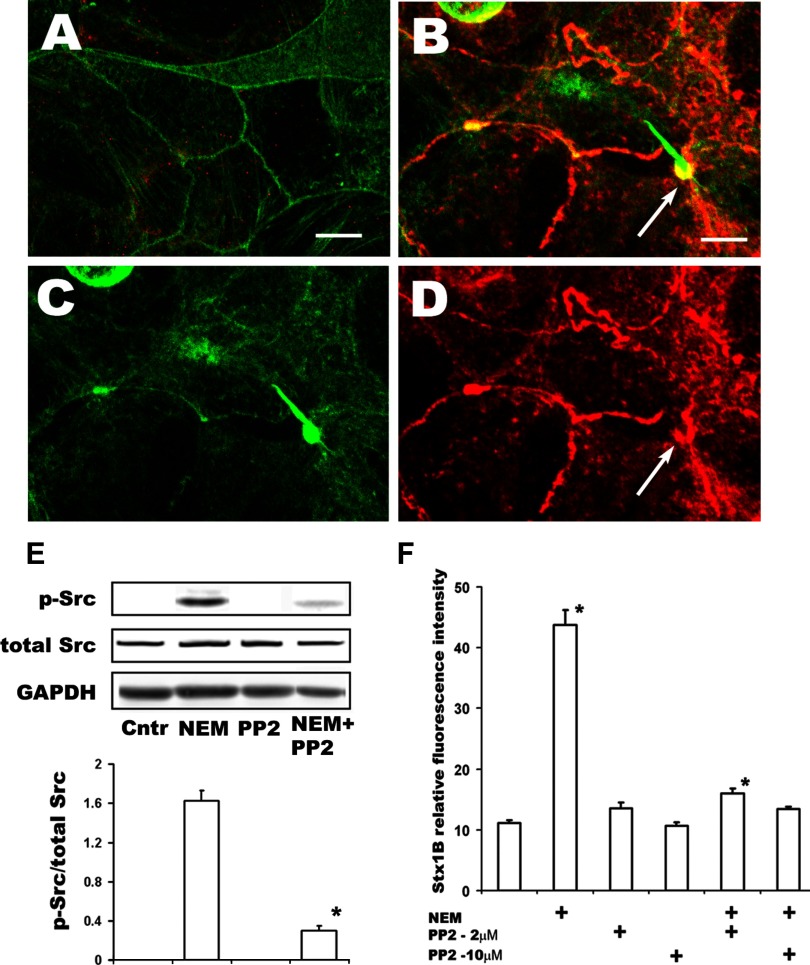
NEM activates Src in T84 cells. A: representative single 3D xy projection from 0.5-μm confocal optical sections of control cells not treated with NEM. Small amount of activated p-Src (red) is present all through the cells. F-actin green (by phalloidin) in all windows. B–D: representative single 3D xy projection from 0.5-μm confocal optical sections of apical region of cells incubated 1 h with 100 μM of NEM. Bars in A and B, 10 μm. Active p-Src (red), which appears in the apical region of cells, follows the pattern of perijunctional F-actin ring (green), displaces the F-actin in it, and concentrates in the base of F-actin ruffles (arrows in B and D). E: immunoblot shows increase in active Src (p-Src Y416) in T84 cells treated with 200 μM NEM for 4 h, whereas in control cells the amount of p-Src was below detection level. Treatment with 10 μM PP2 significantly inhibited Src activation by NEM (*P < 0.05 compared with NEM-stimulated conditions, n = 4 independent experiments done in duplicate). GAPDH loading control. F: the Src family inhibitor PP2 significantly decreased the NEM-stimulated Stx endocytosis but did not affect the basal uptake of toxin by T84 cells. Thus simultaneous pretreatment of cells with 200 μM NEM and 10 μM PP2 for 30 min completely prevents NEM-stimulated Stx1B uptake measured 4 h later. *P < 0.05 compared with control. Each bar represents at least 4 independent experiments done in duplicate.

