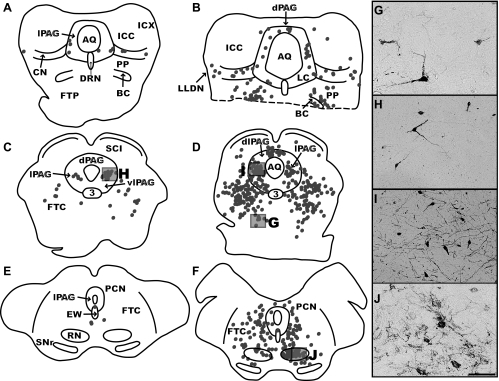
Fig. 6.
Maps of sections through the midbrain and photomicrographs from two intermediate (C38, left column; C51, middle column) cases at different stages of infection. A and B are located at ∼0.6 mm posterior to the interaural plane; C and D at 1.6 mm anterior to the interaural plane; and E and F at 5.2 mm anterior to the interaural plane. The ventral portion of B is missing, as indicated by a dashed line. Each dot represents a single labeled neuron, and boxes indicate the areas depicted in the photomicrographs. G illustrates infected neurons in the mesencephalic reticular nucleus; H and I depict infected neurons in the lateral periaqueductal gray matter (lPAG); and J shows neurons in the red nucleus (RN). Most of the micrographs are from the same cases used to generate the maps, although I is from case C39. Scale bar represents 250 μm. 3, Oculomotor nucleus; AQ, cerebral aqueduct; CN, cuneate nucleus; dlPAG, dorsolateral periaqueductal gray matter; dPAG, dorsal periaqueductal gray matter; DRN, dorsal raphe nucleus; EW, Edinger-Westphal nucleus; ICC, central nucleus of the inferior colliculus; FTC, central tegmental field; FTP, paralemniscal tegmental field; ICX, external nucleus of the inferior colliculus; LC, nucleus locus coeruleus; LLDN, dorsal nucleus of the lateral lemniscus; PCN, nucleus of the posterior commissure; PP, pedunculopontine nucleus; SCI, intermediate layer of the superior colliculus; SNr, substantia nigra pars reticulata; vlPAG, ventrolateral periaqueductal gray matter.

