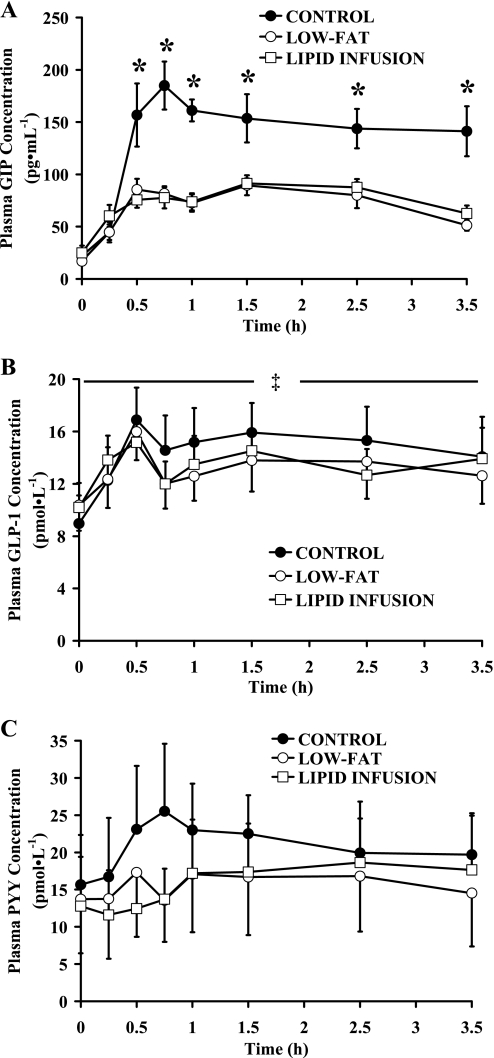
Fig. 4.
Plasma glucose-dependent insulinotropic polypeptide (GIP; A), glucagon-like peptide-1 (GLP-1; B), and peptide YY3-36 (PYY3-36; C) concentrations before and during 5 h after control, low-fat, and lipid infusion meals. Values are means ± SE. *P < 0.05, control significantly different from low fat and lipid infusion. ‡P < 0.05, at 0–5 h AUC, control significantly different from low fat and lipid infusion.

