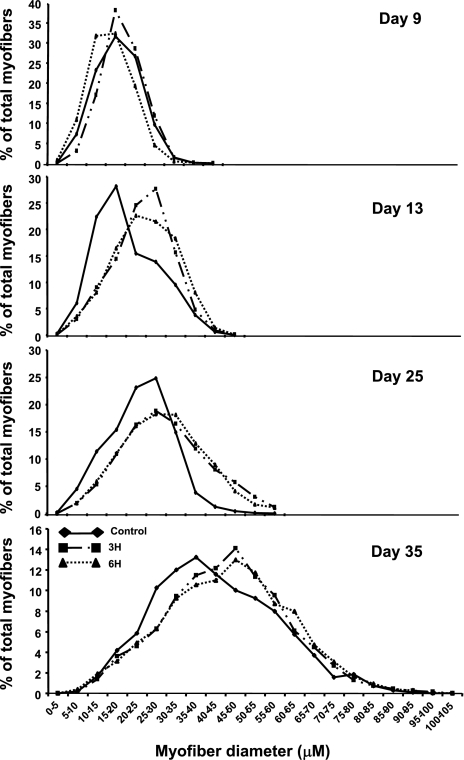
Fig. 2.
Myofiber diameter distribution in pectoralis muscle from control and TM (3H, 6H) groups at various days of age. Myofibers are clustered in bin intervals of 5 μm, and myofiber diameter values are ranked in ascending order within each treatment group. Results are presented as percentage of total fibers.

