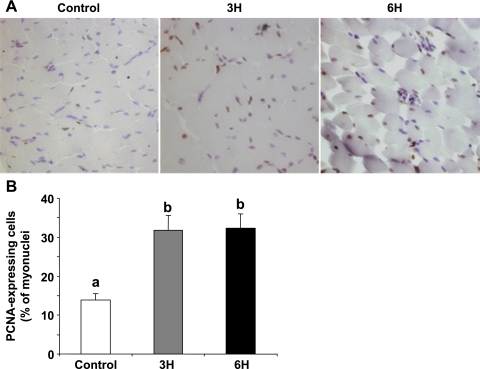
Fig. 4.
A: PCNA staining of pectoralis muscle cross sections prepared from the experimental chicks (control and TM: 3H, 6H) at 9 days of age. Magnification ×200. B: quantitation analysis of the PCNA-expressing cells. Results are means ± SE of PCNA-expressing cells within the myofibers and are presented as percentage of total myonuclei. Five sections were studied per five chicks (n = 5), monitoring five random fields per section (total of 1,000 nuclei per chick) (P < 0.05). Only nuclei within the myofiber perimeter were included in this analysis, and regions rich with connective tissue were not included. a,bData with different letters differ significantly (P < 0.05).

