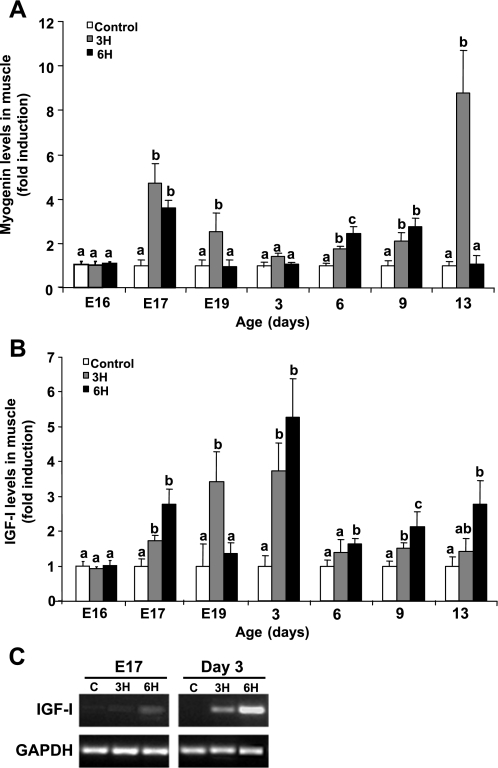
Fig. 6.
Densitometric analysis of myogenin (A) and IGF-I (B) expression relative to α-tubulin protein levels in pectoralis muscle samples derived from control and TM (3H, 6H) embryos and chicks at various days of age. Sample collection and Western blot analysis were performed as described in Fig. 5 legend. Results are means ± SE and presented as fold induction of control (n = 4). a,bData with different letters differ significantly within the same age (P < 0.05). C: RT-PCR analysis for IGF-I mRNA expression levels in myoblasts derived from pectoralis muscle of the experimental chicks on E17 and day 3 posthatch. Equal samples were analyzed and electrophoresed as demonstrated by GAPDH mRNA levels.

