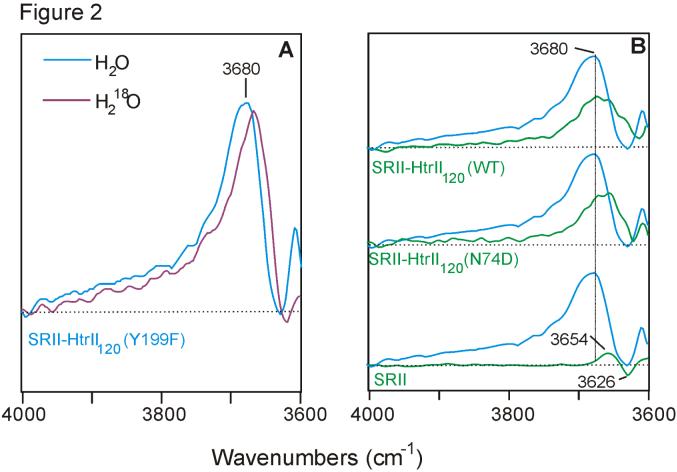
Figure 2.
(A): Comparison of FTIR difference spectra of Y199F mutant of SRII-HtrII recorded in H2O (blue trace) and H218O (purple trace). (B): Comparison of Y199F mutant SRII-HtrII complex (blue traces) with the wild-type (green trace; top) and N74D mutant complex (green trace; middle) and wild-type SRII receptor (green trace; bottom) spectra. The baseline is shown as dotted line. All spectra were recorded at 8 cm-1 spectral resolution corresponding to the data acquisition window of 9.5 ms.

