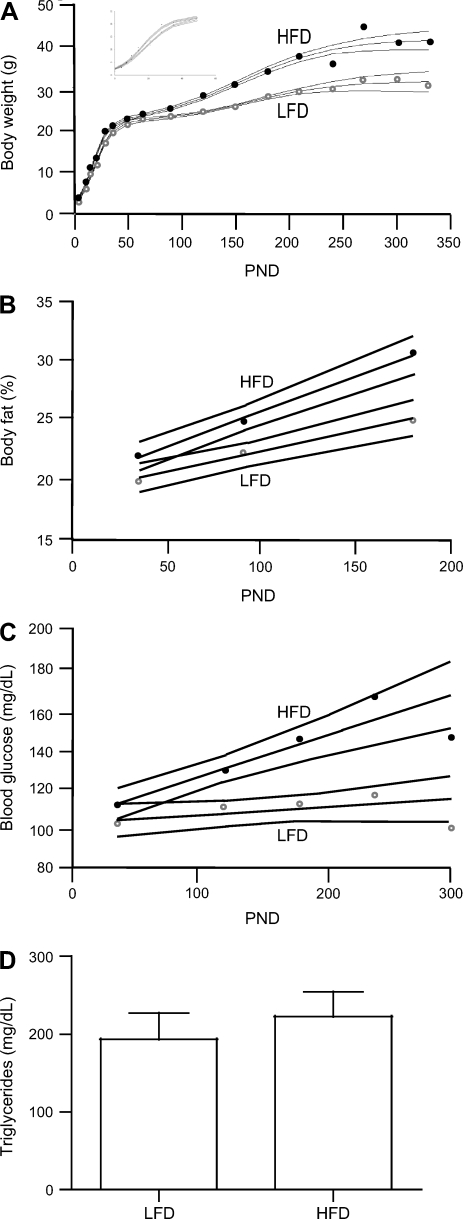
Fig. 2.
Metabolic syndrome-related phenotypes in DMBA mice. High-fat diet (HFD) increases body weight (A), percent body fat (B), and blood glucose (C) over the low-fat diet (LFD). Longitudinal models are depicted per diet with 95% confidence intervals, and diet-based mean is plotted for LFD (○) and HFD (•). For body weight measurement at PND 0, 4, 7, 10, 14, 18, 21, 28, 35, 49, 63, 90, 120, 150, 180, 210, 240, 270, 300, and 330, there were 62, 54, 62, 62, 61, 45, 62, 20, 61, 54, 58, 58, 56, 35, 39, 32, 19, 15, 12, and 11 mice on LFD and 66, 65, 66, 62, 66, 43, 66, 28, 66, 65, 65, 58, 53, 40, 20, 5, 5, 4, 2, and 0 mice on HFD, respectively. For body fat measurement at PND 35, 90, and 180, there were 62, 59, and 33 mice on LFD and 64, 62, and 27 mice on HFD, respectively. For blood glucose measurement at PND 35, 120, 180, 240, and 300, there were 50, 51, 26, 19, and 11 and mice on LFD and 65, 56, 15, 5, and 2 mice on HFD, respectively. D: triglycerides are not impacted by diet (mean ± SE; n = 21 and 23 mice for LFD and HFD, respectively).

