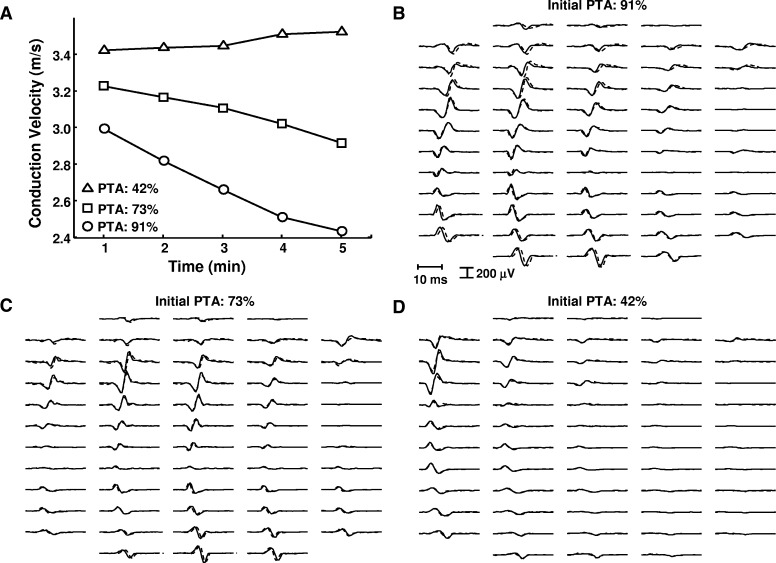
FIG. 6.
Muscle fiber conduction velocity for motor units with different initial percentage of time of activity (PTA) in one representative subject. A: the average conduction velocity of 3 motor units from one subject during the five 1-min intervals of the task. The 3 motor units were active for different proportions of the task. B: the multichannel action potential (12 × 5 bipolar traces, derived from 13 rows × 5 columns of electrodes) of the motor unit with a PTA of 91% during the first (solid lines) and the last (dashed lines) ramp contractions. C and D: same as in B for the other 2 motor units. Because of the low contraction force, the changes in action potential shape over time are small (compare solid and dashed lines).

