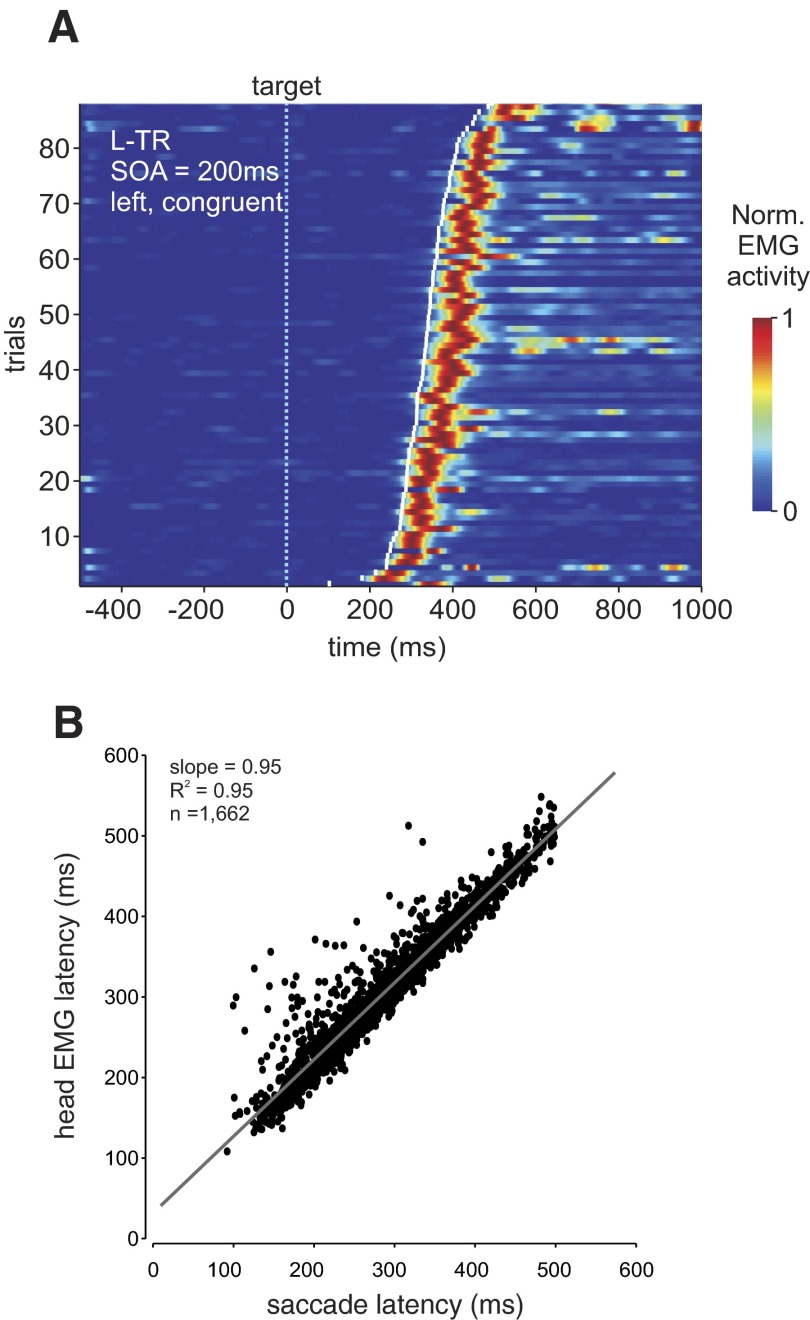
FIG. 4.
Coupling between saccade and head movement (EMG) latencies. A: example of coupling between saccade onset and normalized EMG activity for the left trapezius muscle (L-TR) for 86 leftward movements sorted by saccade onset relative to target presentation (time 0, light blue vertical dotted line). Trials are from the 200-ms SOA condition. Saccade onset is depicted by the white tick marks for each trial. Muscle activity is normalized with respect to peak amplitude and color coded, with 1 (red) equal to maximum activity. B: correlation between head movement latency (based on EMG, y-axis) and saccade latency (x-axis). The regression was as follows: y = 31.7 + 0.954x (gray line).

