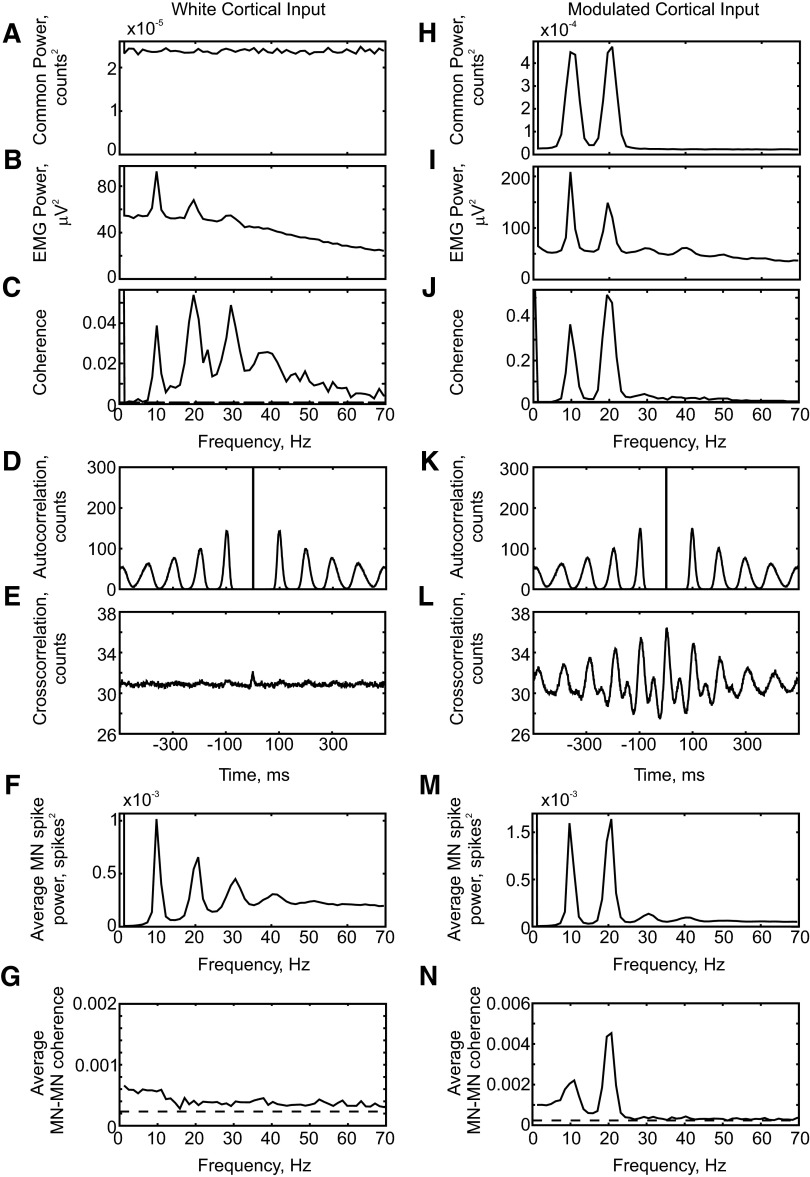
FIG. 2.
Results from simulations (4,017 s) using white-noise cortical inputs (A–G) and a cortical input modulated to produce spectral peaks at 10 and 20 Hz (H–N). A and H: power spectrum of cortical input. B and I: power spectrum of rectified electromyogram (EMG). C and J: coherence between cortical input and rectified EMG. D and K: motoneuron spike autocorrelation, averaged over all cells in the motoneuron pool. E and L: cross-correlation between motoneuron spikes, averaged over all possible pairs of motoneurons in the pool (E was smoothed using a Gaussian kernel, width 0.5 ms). F and M: power spectrum of the population spike activity of the motoneurons. Bin width of 1 ms in time domain plots. G and N: average coherence between motoneuron spike trains (averaged over 100 pairs of motoneurons, chosen at random).

