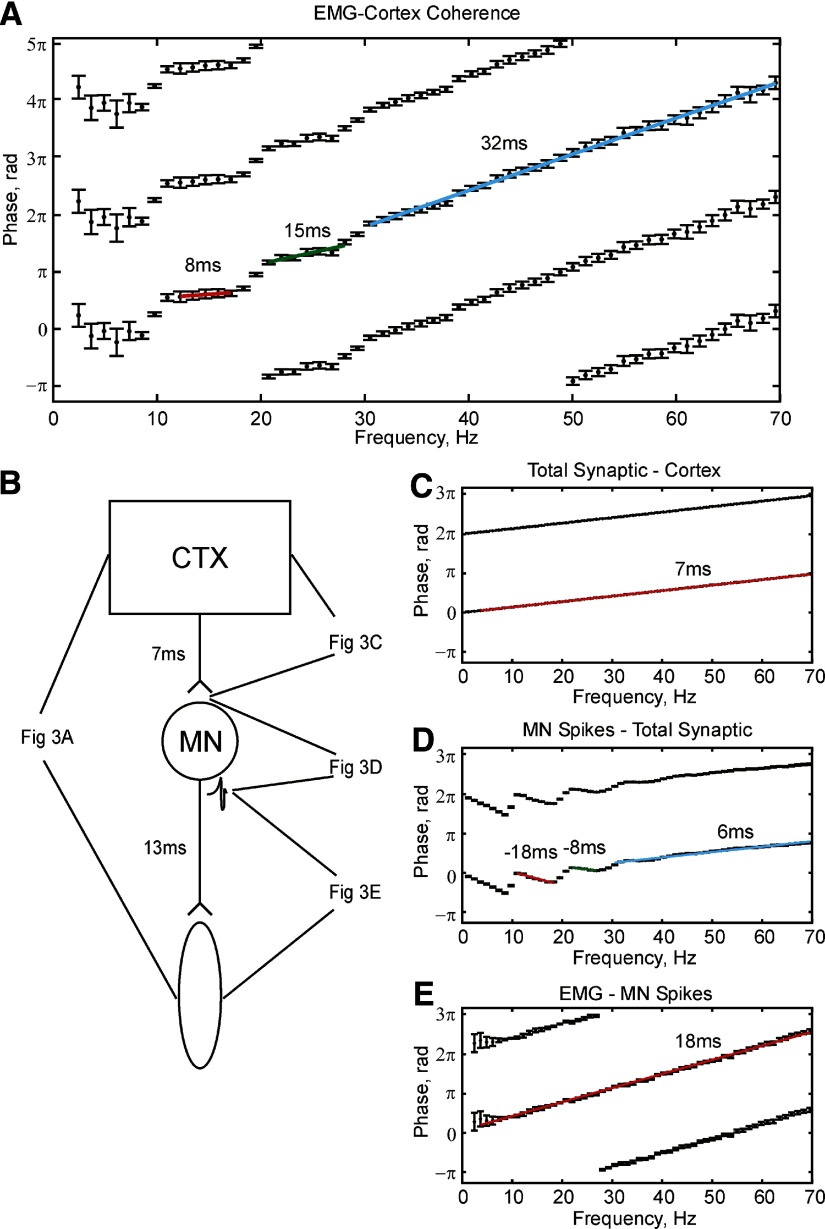
FIG. 3.
Phase–frequency relationships calculated from the coherence between different outputs of the simulation. Signal pairs are denoted “output signal–reference signal”; a positive slope indicates that the output signal lags the reference. Error bars indicate 95% confidence limits on phase. A: cortical input–EMG coherence phase. B: schematic of the model showing the signals analyzed in each panel of the figure. C: coherence phase for total synaptic input–common input. D: population motoneuron spikes–total synaptic input to motoneurons. E: EMG, population MN spikes. Simulation was 4,017 s long.

