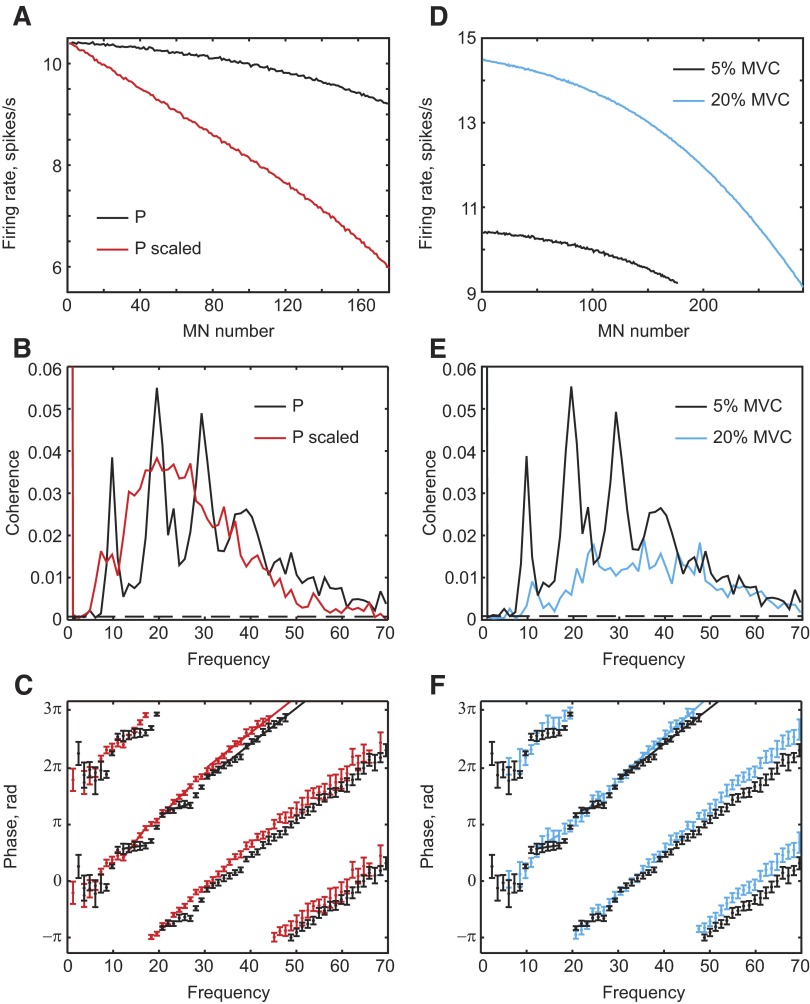
FIG. 6.
A: firing rate vs. motoneuron number at a contraction strength of 5% maximal voluntary contraction (MVC), for the standard model (black) and one where the parameter P has been rescaled to produce greater variation across the motoneuron pool (red). Corticomuscular coherence (B) and corticomuscular coherence phase (C), for the 2 simulations. D–F: plots similar to those of A–C, but for the comparison of contraction strengths of 5% MVC (black) and 20% MVC (blue). Simulation length was 8,034 s for all plots.

