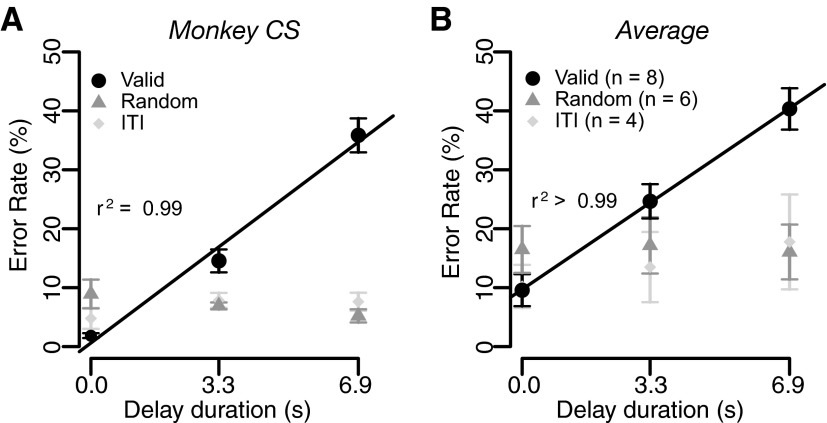
FIG. 3.
Effect of predicted delay-to-reward on error rate. Percentage of error trials (mean ± SE) as a function of delay duration in (A) monkey CS and (B) in the average across monkeys in the reward-delay task. Black circles, gray triangles, and light gray diamonds indicate valid cue condition, random cue condition, and the next-trial delay task, respectively. The black lines are the regression lines [E = k × delay + constant; (A) k = 4.9 and (B) 4.5 (ranging from 1.8 to 6.6 in 8 monkeys); the r2 values are reported in the plots.] Number in parentheses represents the number of subjects.

