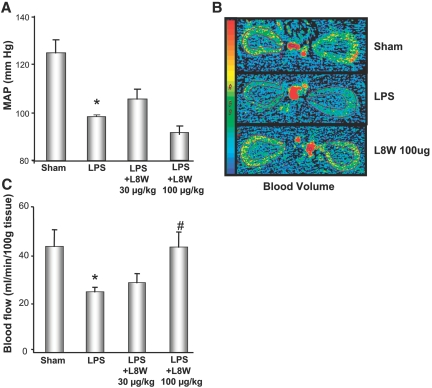
Figure 5.
Effect of L8W on MAP and renal blood flow during endotoxemia. (A) Determination of MAP in the presence of L8W (30 and 100 μg/kg). (B) Representative CT images depicting renal blood volume after L8W treatment 3 h post-LPS administration. (C) Renal blood flow in the presence of L8W (30 and 100 μg/kg). Data are represented as mean ± SEM, n = 6 per data group. *P ≤ 0.05 as compared with sham, #P ≤ 0.05 as compared with respective LPS-treated group.

