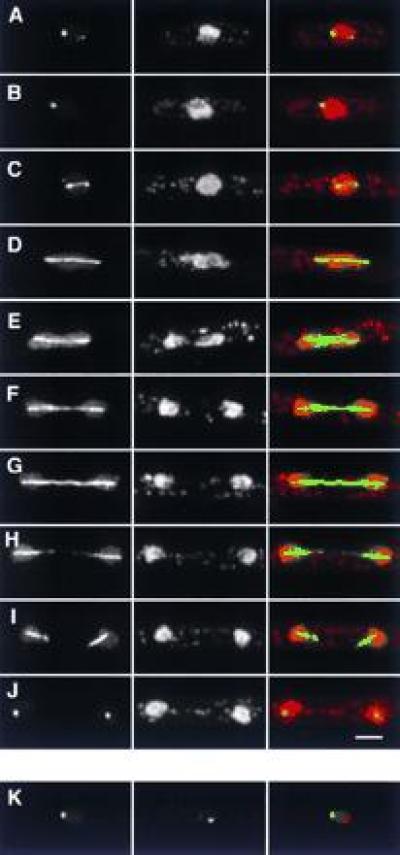
Figure 6.

Localization of S5. (A–J) Localization in interphase and in different stages of mitosis. (Left) GFP; (Center) DNA (PI stain); (Right) merged image of GFP (green) and DNA (red). Note the fainter, secondary spots in both interphase (A) and early mitosis (C), the collapse of spindle localization into a single spot at the end of mitosis (J), and the lack of increased S5 fluorescence at spindle poles. (K) Comparison of S5 and spindle pole body localization. (Left) GFP; (Center) anti-sad1p; (Right) merged image of GFP (green) and anti-sad1p staining (red). The two signals are distinct. (Bar = 2 μm.)
