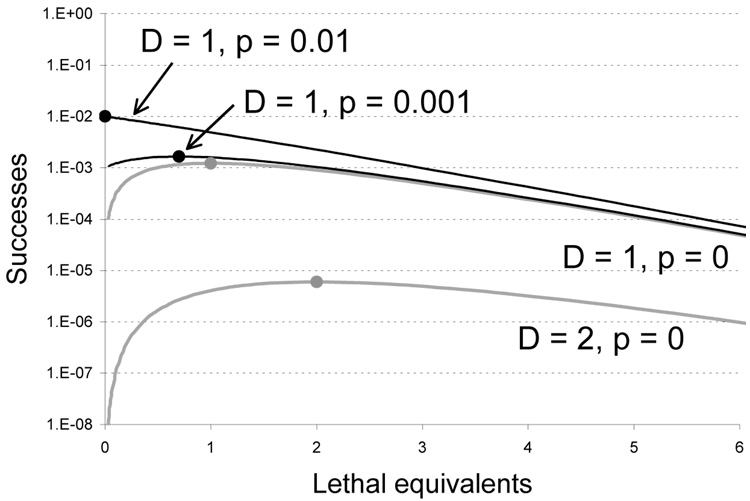
Figure 3.
Effect of initial frequencies on recovery of beneficial mutants. Both gray curves (lower) assume the strict absence of mutant phenotypes before mutagenesis, whereas the black curves (upper) are drawn for mutant phenotypes present initially (D = 1; p = 0.001, D = 1; p = 0.01). The main effect of having mutants initially present occurs at low levels of mutagenesis, and the optimum is shifted toward or to 0. The optima are shown as circles on their respective curves. Otherwise as in Fig. 1.

