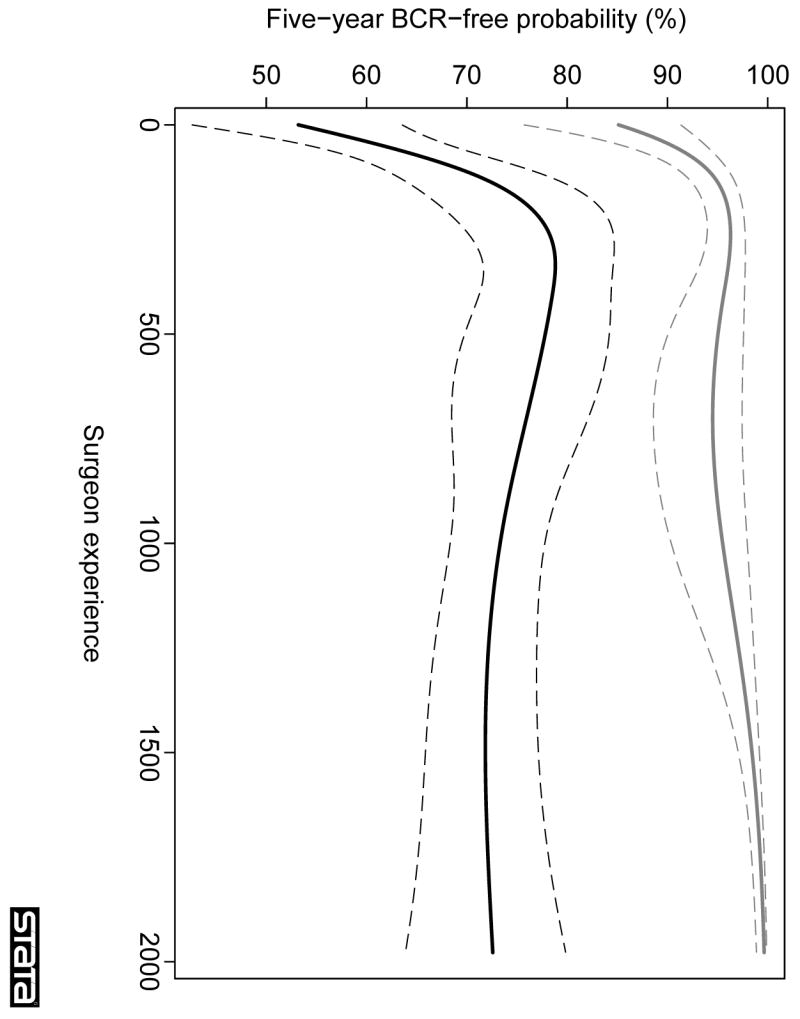
Fig. 3.

Learning curve for cancer control after radical prostatectomy, stratified by presence of organ-confined disease, in patients treated after 1995 (sensitivity analysis). The graph illustrates the predicted probability of freedom of biochemical recurrence (BCR) at 5 yr with increasing surgeon experience. Probabilities are for a patient with typical cancer severity (mean PSA, pathological stage, and grade) within each group. Grey lines, organ-confined disease; black lines: locally advanced disease; dashed lines, 95% CIs.
