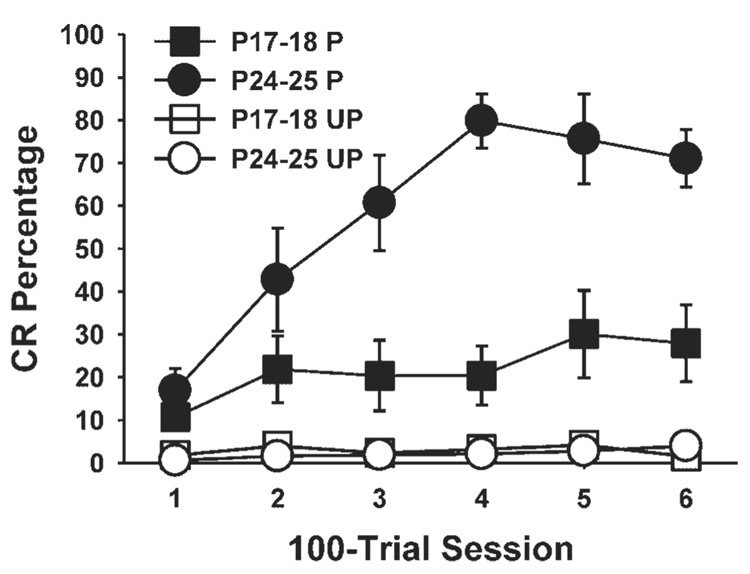
FIGURE 3.
Mean (±standard error) conditioned response (CR) percentage for rat pups given paired (black symbols) or unpaired (white symbols) presentations of cochlear nucleus stimulation as the conditioned stimulus and the unconditioned stimulus on postnatal days (P) 17–18 (squares) or P24–25 (circles). The amount of learning in each paired group is determined by the increase in responding across training sessions and greater responding than the unpaired control groups.

