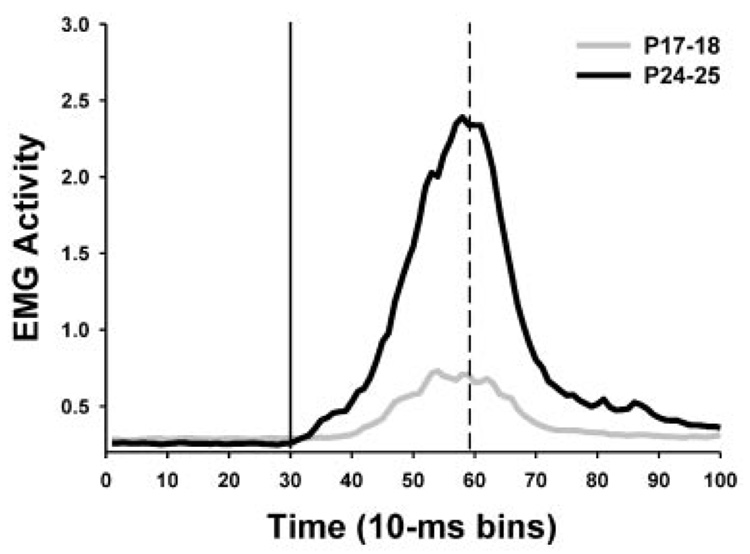
FIGURE 5.
Averaged eyelid EMG activity for pups given paired training on P17–18 (gray line plot) and P24–25 (black line plot) during the entire trial epoch for all CS-alone test trials for the last training session. The solid vertical line indicates the onset of the conditioned stimulus. The dashed line indicates the onset of the unconditioned stimulus.

