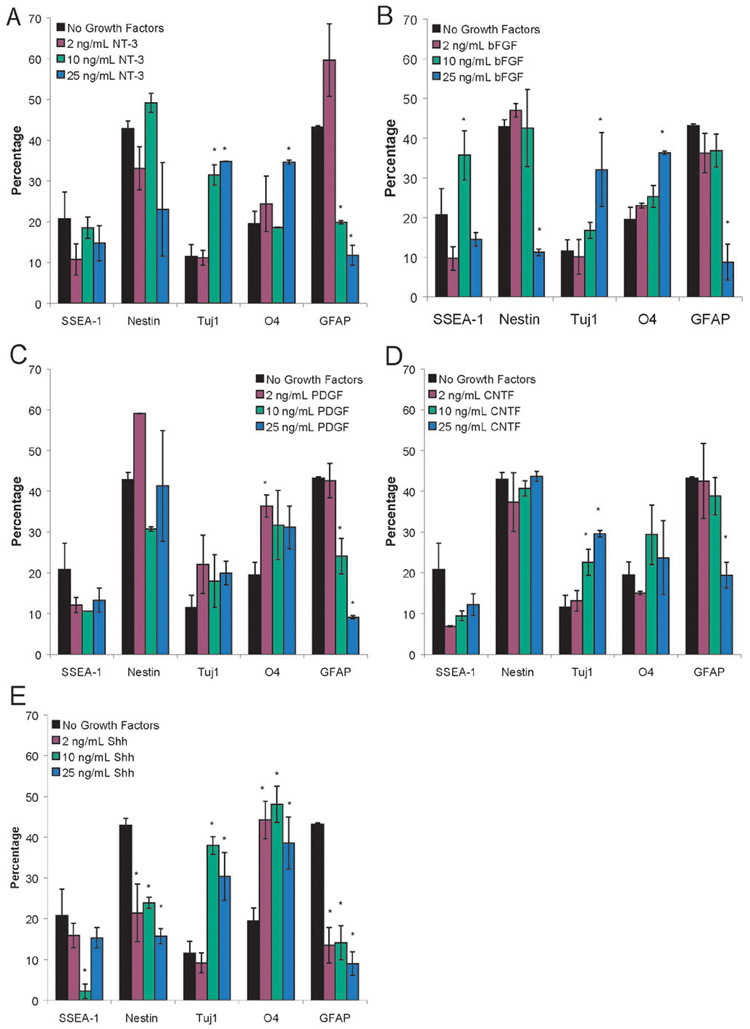
Figure 3. Results of FACS analysis on the dose response studies of EBs cultured in fibrin scaffolds for 14 days in the presence of individual growth factors at the following concentrations: 2, 10, and 25 ng/mL.
A) EBs seeded into fibrin scaffolds after 14 d of culture in the presence of NT-3. B) EBs seeded into fibrin scaffolds after 14 d of culture in the presence of bFGF. C) EBs seeded into fibrin scaffolds after 14 d of culture in the presence of PDGF. D) Results of FACS analysis performed on EBs seeded into fibrin scaffolds after 14 d of culture in the presence of CNTF. E) Results of FACS analysis performed on EBs seeded into fibrin scaffolds after 14 d of culture in the presence of Shh. The markers examined were SSEA-1 (undifferentiated mouse ES cells), nestin (neural precursors), Tuj1 (neurons), O4 (oligodendrocytes), and GFAP (astrocytes). * indicated p < 0.05 for that marker compared to EBs cultured in fibrin for 14 days with no growth factors present.

