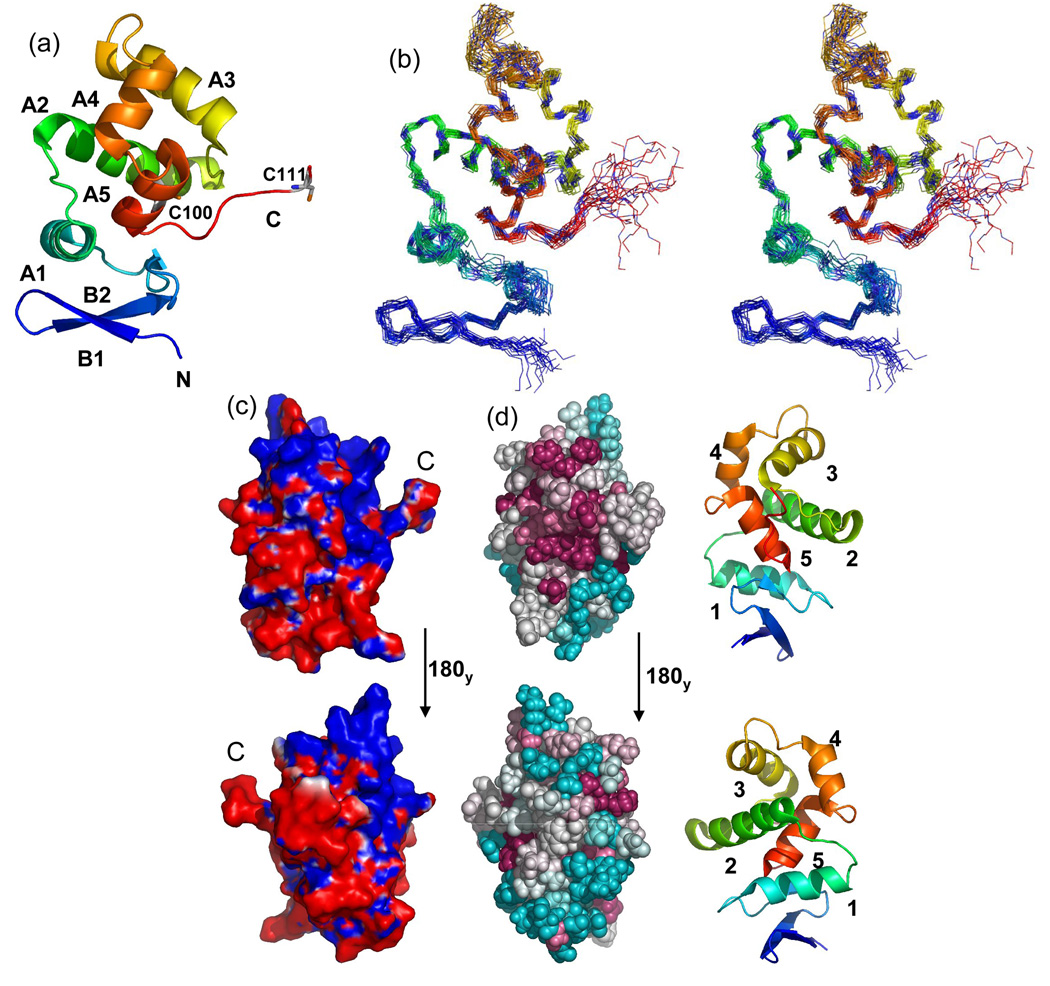
Fig. 2. DsrC ribbon structures, ensemble stereoview, electrostatic surface, and structural map of conserved residues.
(a) Ribbon cartoon of A. vinosum DsrC. The amino-terminus is blue, the carboxy-terminus is red. The amino-terminal hexa-His tag is not shown. Alpha helices and beta strands are labeled. Positions of cysteines are shown. Only a single conformation of the dynamic carboxy-terminal segment (residues 107–112) is shown. (b) Stereoview of A. vinosum DsrC ensemble. The amino-terminus is blue; the carboxy-terminus is red. The amino-terminal hexa-His tag is not shown. (c) Molecular surface colored by electrostatic potential. Red and blue colors correspond to units of -1 and +1 kbT/ec. The perspectives are related by a 180 deg. rotation about the y-axis. The left view is the same as in Figs. 3a and 3b. (d) ConSurf35 depiction of sequence conservation in the DsrC/TusE multiple sequence alignment mapped onto the Ach. vinosum DsrC structure. For reference, numbered ribbon cartoon structures appear to the right of each ConSurf map. The upper structures are rotated 90 degrees about the y-axis from that the orientation in Fig. 3a, so as to look directly upon the carboxy-terminus. Lower structures are rotated 180 degrees again about the y-axis. Darker, warmer colors indicate greater residue conservation.

