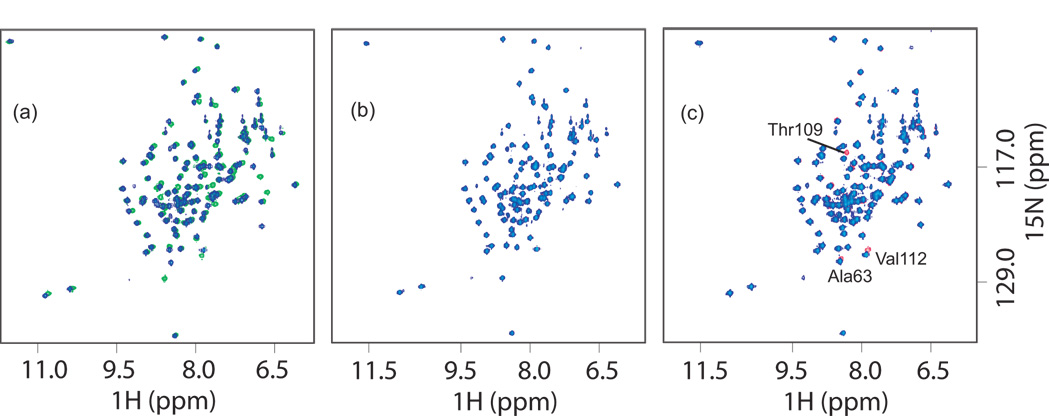
Fig. 6. 1H-15N HSQC spectra of DsrC and mutants.
(a) Native DsrC (green) and DsrC Cys100Ser/Cys111Ser (blue) in reducing conditions showing effects of introducing Cys mutations. Shifts in peaks are due to neighbor effects near mutated residues. (b) DsrC Cys111Ser with DTT (blue) and without DTT (red, not visible because there is no change in the spectra and they are underneath the blue peaks). (c) DsrC Cys100Ser with DTT (blue) and without DTT (red). Changes occur around residue Cys111 due to disulfide formation, and at Ala63 (see text). .

