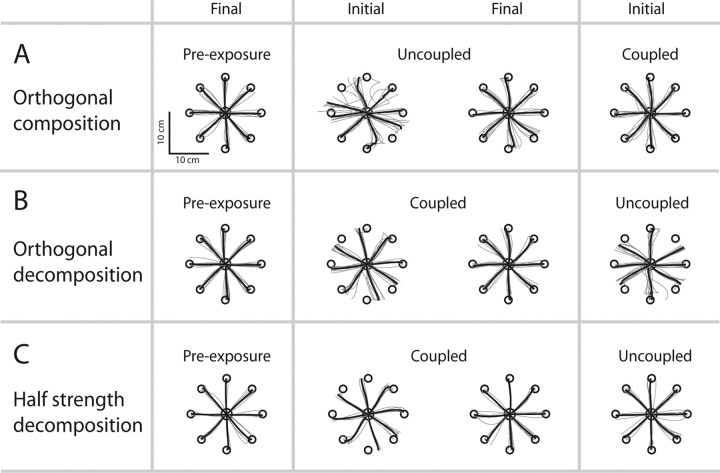
Figure 3.
All individual subject and mean outward right-hand paths at different stages of the experiment. To enable the mean to be calculated, each trajectory has been truncated to the shortest outward path across the subjects. A–C, Shown are the trajectories for the composition, decomposition, and decomposition control paradigms, respectively.

