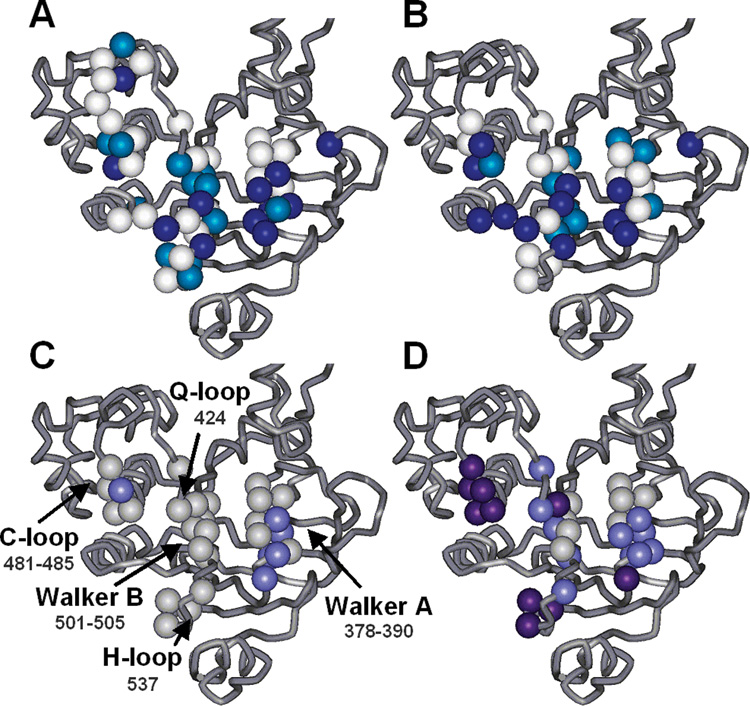
FIGURE 7.
Illustration of results for each site studied overlaid onto the open face of the E. coli MsbA NBD. (A) In vivo growth assay results. Mutants with little or no growth (<25% of the WT rate) are colored dark blue, those with intermediate growth light blue, and those with full growth (>75% of the WT rate) white. (B) In vitro ATPase activity results using the same color scheme as in panel A but corresponding to hydrolysis rates as a percentage of WT rather than growth rates. (C and D) Changes in spin label mobility as observed by EPR (C) upon addition of ATP/EDTA and (D) upon addition of MgATP/Vi. Cases in which there are no changes in the mobility of the spin label side chain compared to the resting state are colored gray, cases in which there are small changes light purple, and cases in which there are large changes dark purple. The sites that do not show changes upon vanadate trapping include L505C and E506C, which are considered inactive in each of the functional assays.

