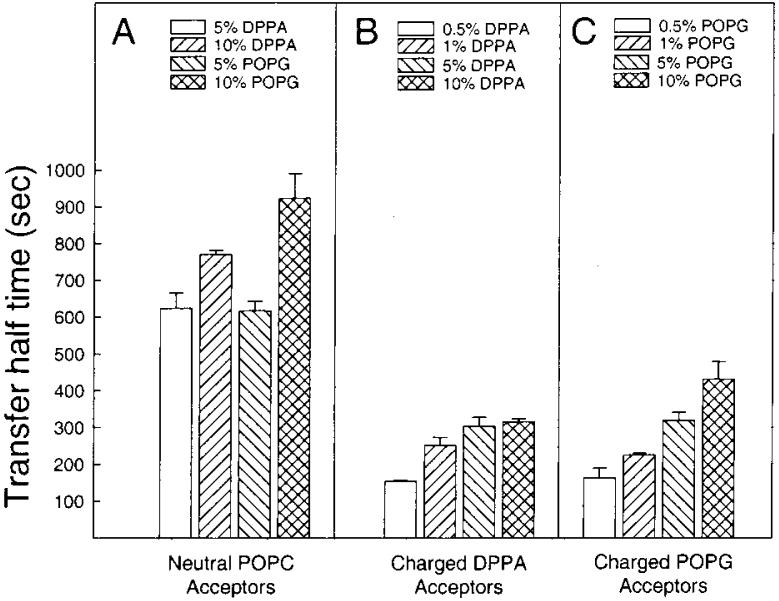
FIGURE 9.
Transfer half-times for different acceptor vesicle compositions. Panel A shows the transfer rate for negatively charged donors and neutral acceptors, whereas panels B and C show the transfer rate for neutral donors with negatively charged acceptors. The amount of GLTP in each experiment was 2.0 μg. Values are averages ± SD of at least 3 different experiments.

