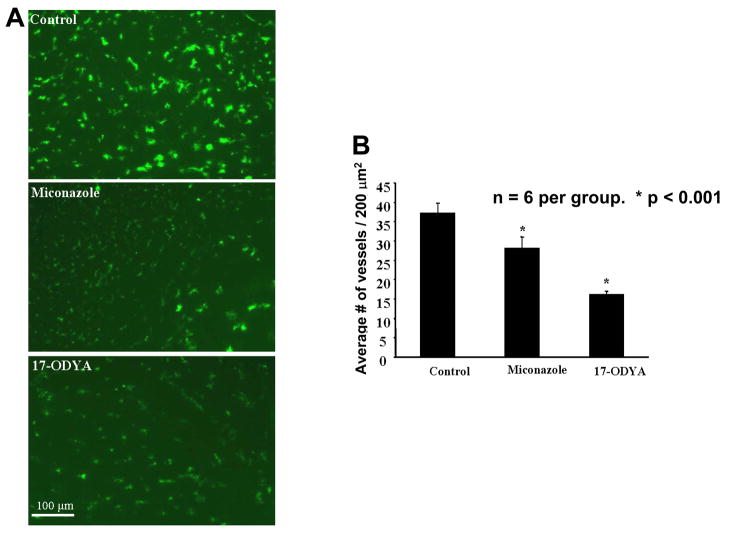
Figure 3.
(A) Representative images of tumor vasculature captured following perfusion with FITC-conjugated dextran in the absence or presence of the CYP epoxygenase inhibitors. At the termination of the experiment, the animals were anesthetized, briefly perfused with FITC-conjugated dextran in a saline solution, the brains quickly removed and frozen sections prepared for fluorescence microscopy. The green spots represent blood vessels. (B) Bar graph representing the average number of blood vessels in 200 μm2 area (n=6 per group).

