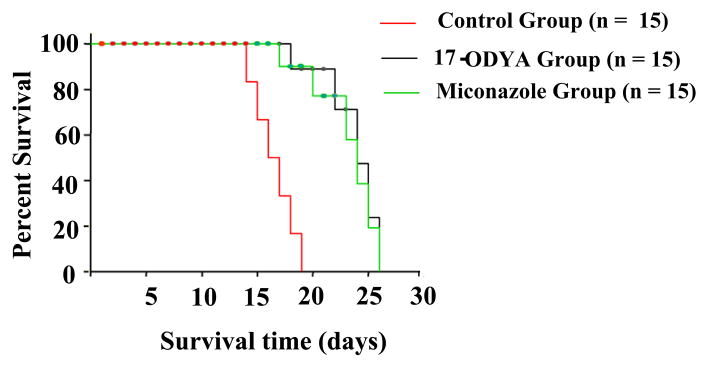
Figure 4.
Shows the survival time of rats in days of different treatment groups with glioblastoma multiforme. Red line denotes the control group with the least survival time compared to blue and black lines that are miconazole and 17-ODYA treated groups, respectively. The statistical significance of survival analysis were computed using multiple comparison procedures of Holm-Sidak method, n = 15 per group P <0.05.

