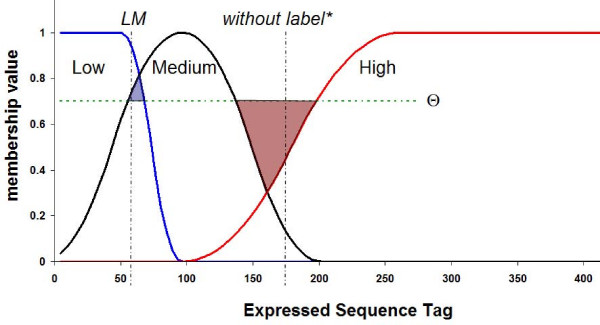
Figure 1.
Shape of membership function for a specific gene and possible assigned labels given a threshold θ = 0.7. The centre and amplitude of each membership function depend on the mean and on the variability of the available data respectively. The Medium membership function is considered symmetric whereas the Low and High functions are asymmetric in the extremes.

