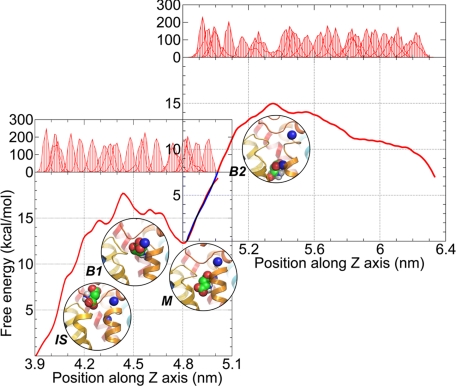
Fig. 3.
Free energy profiles along the putative permeation pathway. The bottom left and upper right figures refer to the first and second phases (pathway P1), respectively. The curve in the overlapping region in the upper right figure is colored blue. The position distributions of aspartate obtained via umbrella sampling MD simulations for a series of windows along the z axis are shown in the upper abscissa. Four snapshots corresponding to the initial state (IS), the first energy barrier (B1), the local energy minimum (M), and the second energy barrier (B2) are shown, which highlight the relative positions of aspartate and sodium ions. See Fig. 4 for more details on these snapshots.

