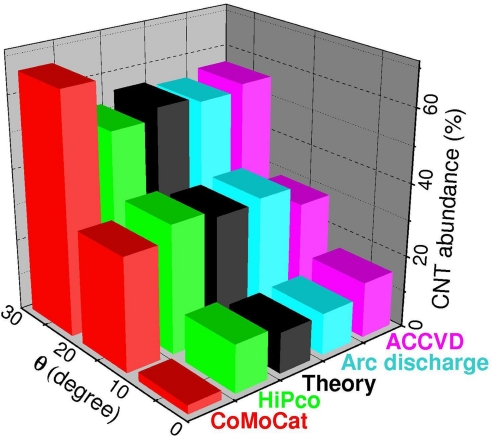
Fig. 3.
The distribution of CNT product as a function of chiral angle θ. Experimental data of CoMoCat (25), HiPco (24), arc discharge (28), and ACCVD (27), are extracted from literature. The present model and Eq. 1 predict N ∝ (θ), which yields 11%, 33%, and 56% for the presented intervals (black-gray), to be compared with experimental data (colored).

