Fig. 1.
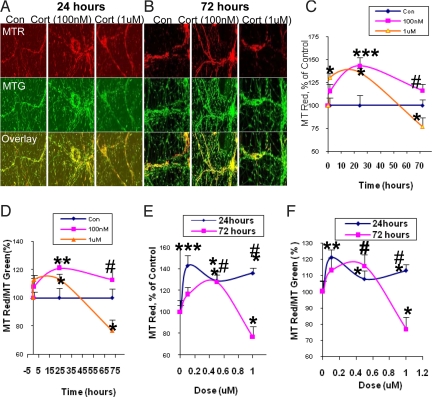
Mitochondrial oxidation has an inverted “U”-shaped relationship with CORT dose. Cortical neurons (10–12DIV) were treated with 100 nM, 500 nM, or 1 μM CORT for 1 h, 1 day, or 3 days and stained with MTR and MTG. Data were combined from 2–3 independent experiments and presented as mean ± SE (*one-way ANOVA ***P < 0.001, **P < 0.05,*P < 0.01 compared to control; # P < 0.05 compared to group of 1 μM and 72-hr treatment, n = 32–70). (A) The sample image of MTR and MTG staining after CORT treatment for 24 h. (B) The sample image of MTR and MTG staining after CORT treatment for 72 h. (C) Time course of mitochondrial oxidation by MTR. (D) Time course of mitochondrial oxidation by MTR/MTG ratio. (E) Dose-dependent curve for mitochondrial oxidation by MTR. (F) Dose-dependent curve for mitochondrial oxidation by MTR/MTG ratio.

