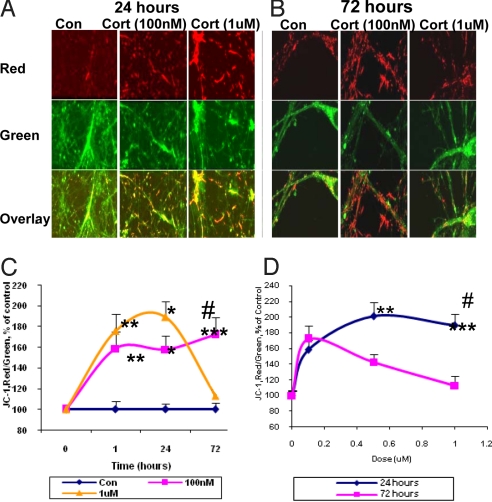
Fig. 2.
CORT modulates membrane potential in a dose- and time-dependent manner. Data were combined from 2–3 independent experiments and presented as mean ± SE (*one-way ANOVA, *P < 0.05, **P < 0.01, ***P < 0.001 compared to control, #P < 0.01 compared to 72 h and 1 μM CORT treatment, n = 34–90). (A) JC-1 staining image after 24 h treatment with 100 nM and 1 μM of CORT. (B) JC-1 staining image after 72 h treatment with 100 nM and 1 μM of CORT. (C) Time course of JC-1 staining after CORT treatment. (D) Dose-dependent curve for JC-1 staining after CORT treatment.

