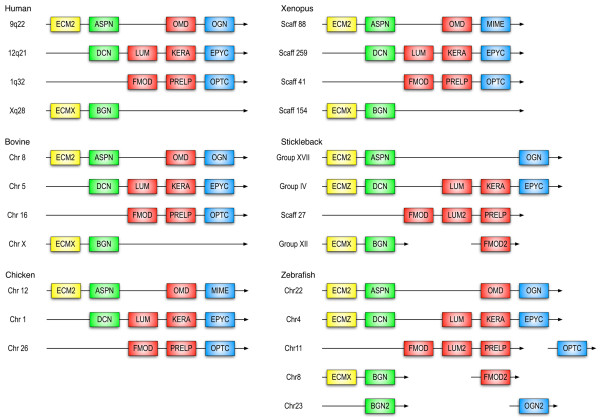
Figure 11.
Synteny of the genes from canonical SLRPs in several vertebrate genomes. Chromosomal or group location is shown when available in the ENSEMBL database, otherwise scaffold information is provided. Members from the four classes are shown in different colours: yellow (class A), green (class I), red (class II) and blue (class III). Genes shown consecutively do not have any other currently known genes in between, whereas the OPTC, FMOD2 and OGN2 genes in zebrafish and stickleback are separated from the other SLRPs by non-SLRP genes.

