
Figure 1.
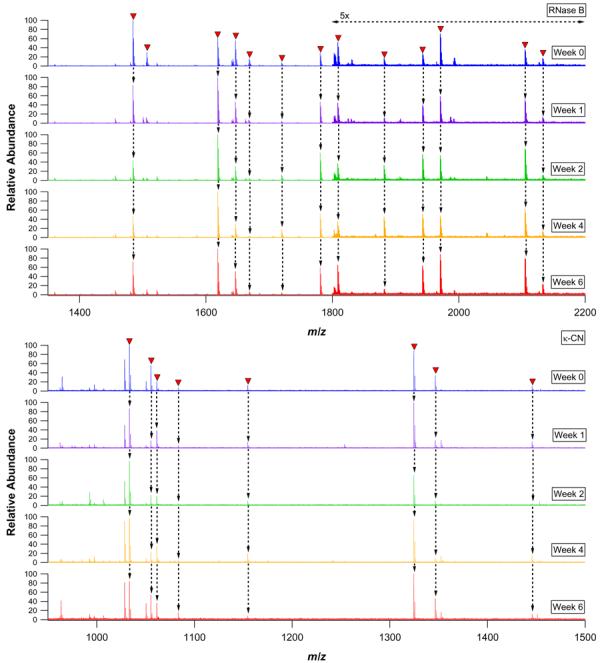
nESI-FTICR mass spectra of 24 h RNase B (upper panel) and κ-CN (lower panel) pronase bead digests performed using the same bead preparations at several intervals over the course of six weeks. Glycopeptide signals are labeled with closed triangles and traced with arrows to the spectra below.