
Figure 3.
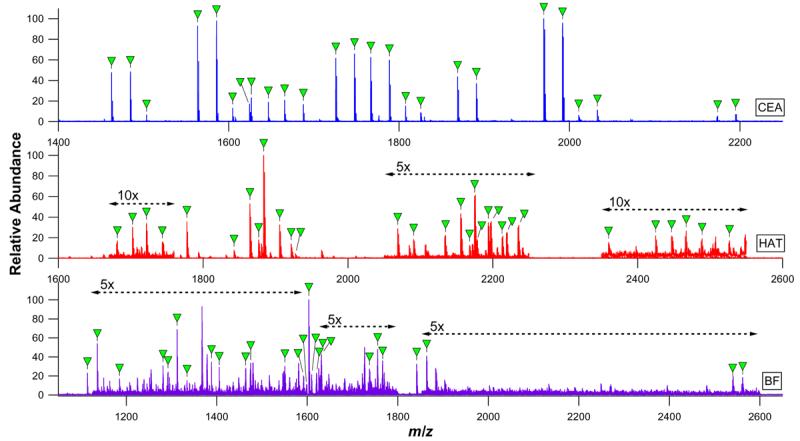
nESI-FTICR mass spectra of CEA, HAT, and BF digests. Glycopeptide signals are labeled with closed triangles and correspond to the glycopeptide compositions listed in Supplementary Tables 1 through 3.
Official websites use .gov
A
.gov website belongs to an official
government organization in the United States.
Secure .gov websites use HTTPS
A lock (
) or https:// means you've safely
connected to the .gov website. Share sensitive
information only on official, secure websites.
nESI-FTICR mass spectra of CEA, HAT, and BF digests. Glycopeptide signals are labeled with closed triangles and correspond to the glycopeptide compositions listed in Supplementary Tables 1 through 3.