
Figure 4.
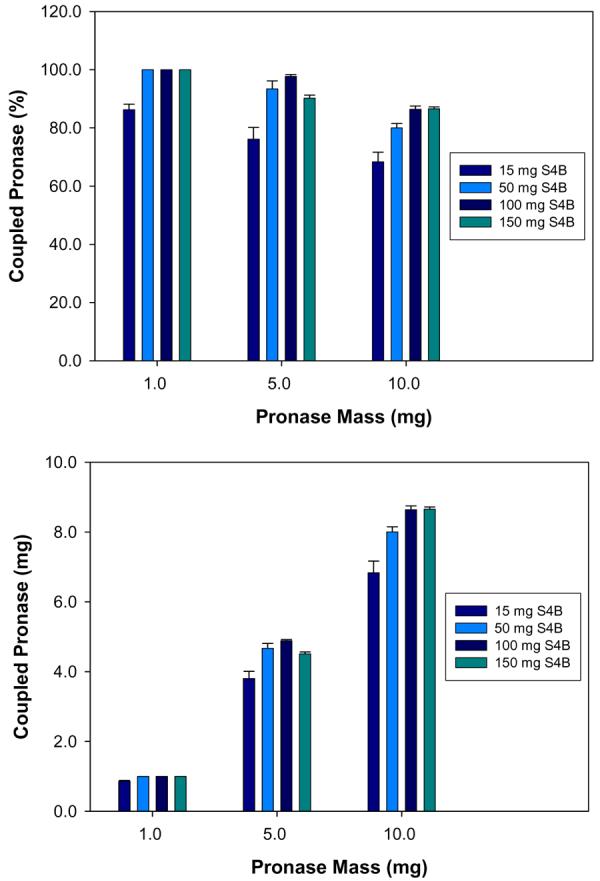
Mean coupling efficiencies of differing masses of PE to varying amounts of S4B beads. Error bars represent the standard deviation of four coupling reactions. The amount of successfully coupled PE is expressed in both relative (upper panel) and absolute (lower panel) terms.