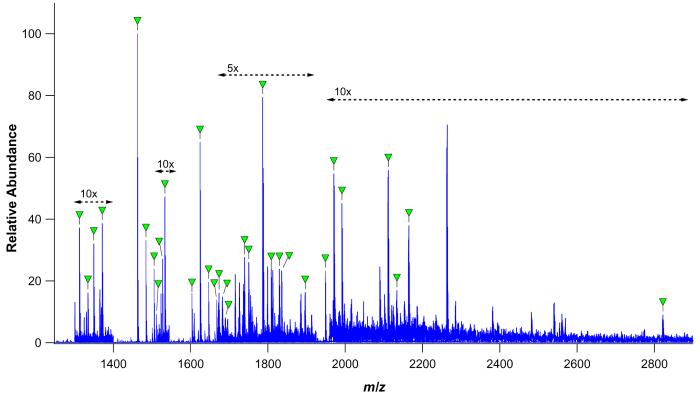
Figure 6.
nESI-FTICR-MS analysis of a 1:1:1:1 (by mass) mixture of RNase B, κ-CN, BF, and the nonglycosylated protein BSA. Glycopeptide signals are labeled with closed triangles and correspond to the glycopeptide compositions listed in Supplementary Table 4.

