
Figure 6.
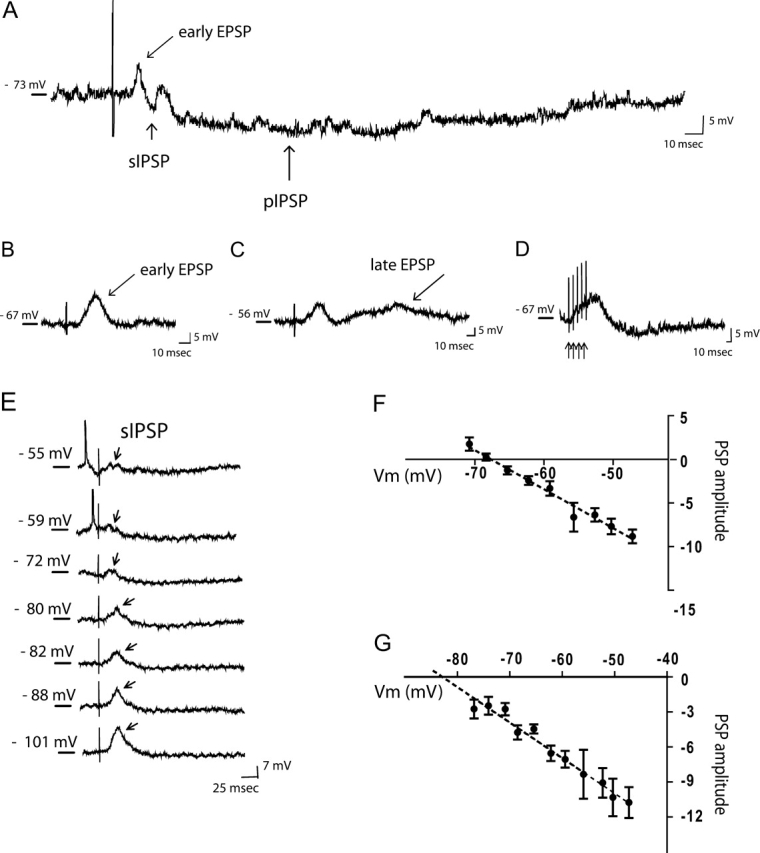
Stimulation of EC evokes both excitatory and inhibitory postsynaptic responses in mPFC neurons. (A) Representative trace from a RS pyramidal neuron shows a mix of postsynaptic responses evoked following EC stimulation; in particular, the trace illustrates the presence of both a short, fast IPSP (sIPSP, arrow) and a pIPSP (arrow), subsequent to the elicitation of an early EPSP. (B) Trace shows a detail of an early EPSP (arrow), followed by an inhibitory response. (C) In this neuron, single-pulse stimulation of the EC evokes an early EPSP and late EPSP (arrow). (D) Example traces of train stimulation that evokes a more pronounced EPSP. (E–G) The sIPSP and the pIPSP exhibited distinct reversal potentials. (E) Depolarizing or hyperpolarizing the membrane of this neuron from resting membrane potential (−69mV; arrow) shows a reversal of the sIPSP component (arrows) at ∼ 69 mV. Each trace was obtained by injecting 0.2 nA steps of current. (F) Plotting the amplitude of the short-latency IPSP against the membrane potential at which it was evoked demonstrates a reversal potential of −69.5 mV in this case, which is consistent with activation of a Cl− conductance. (G) Plotting the amplitude of the pIPSP versus membrane potential reveals a reversal potential of −83 mV in this case, which is consistent with activation of K+ conductances. PSP amplitude= postsynaptic potential amplitude. In all traces, the vertical line represents the stimulus artifact.