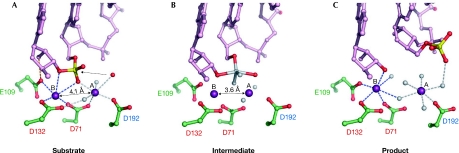
Figure 3.
The reaction catalysed by RNase H1 enzymes. (A) Substrate or pre-reactive state. The RNA is shown in pink ball-and-stick representation with the scissile phosphate shown in red and yellow, the attacking nucleophile is shown as a red sphere and the two Mg2+ ions as purple spheres. The contact between Glu (E)109 and the 2′-OH is shown as an orange line. The numbers of the active-site carboxylates are given and are colour-coded as described in Figs 1B and 2. (B) The transition state model based on a structure with a non-phosphorylated nick at the active site. The observed oxygen atoms are shown in red and the modelled transition state atoms are shown in grey. The dashed line indicates the bond that will be broken in the reaction. Note that the distance between the metal ions is shorter than in (A). (C) Product complex. After the reaction is complete, and the 5′-phosphate and 3′-OH are generated, the phosphate group is displaced from the active site. The representations are based on the structures of Bacillus halodurans RNase H1 enzyme in complex with RNA/DNA hybrids as follows: (A) partly inactive D192N mutant, Protein Data Bank (PDB) code ; (B) D192N mutant, PDB ; and (C) E188A mutant, PDB .

