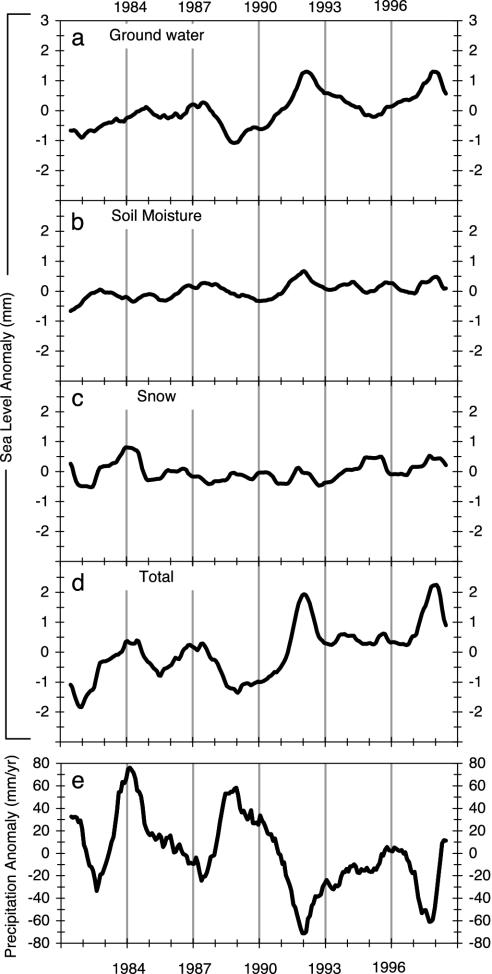
Fig. 2.
Time series of climate-driven changes in continental water mass, expressed as equivalent global sea-level anomalies (mm) for 1981–1998 [ground water (a), soil water (b), snowpack (c), sum of a–c (d)], and time series of CMAP precipitation anomaly over land (e). (Note that a positive trend in each of the first four panels corresponds to a decrease in terrestrial water storage.) For this analysis of interannual variability, we removed the total seasonal (annual and semiannual) signals from each variable and applied a 12-month running-mean smoother to the residuals.

