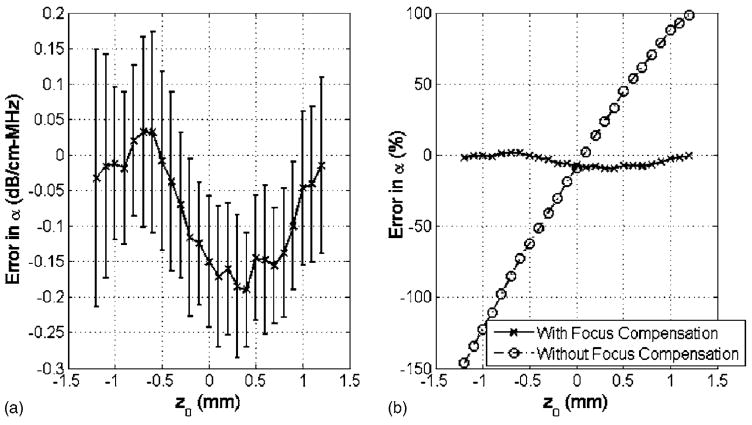
FIG. 2.
(a) Difference between estimated and simulated attenuation slope value of 2 dB/cm-MHz plotted vs location along the echo in the simulations using a bandwidth of 35 MHz. The error bars represent one s.d. above and below the mean as calculated using the 20 independent sets of 50 wave forms. (b) Mean error in attenuation vs location along the echo in the simulations both with and without focusing compensation.

